Prompts
for Forum 2a: Evans Basic Statistics: Chapters 1-4
Here are a few additional exercises
(and some additional instruction) to go with Chapters 1-4 (actually 2-3) in
Evans’ Basic Statistics Web Site. Please complete the exercises and, briefly, provide answers and comments on Forum 2a. You can work
in groups on these exercises.
Exercise
1: When and why would you prefer the median
over the mean?
When reporting statistics summarizing
such phenomena as national achievement levels (or trends) districts commonly (or
should commonly) use median national
percentiles instead of mean national
percentiles. Using the mean in these cases would have been incorrect. Can you
explain why?
Exercise
2: Can you explain, in simple terms, what the standard
deviation tells us?
In Evan’s Lesson 2 you were
introduced to the standard deviation.
Here is another, layman’s definition of the standard deviation.
The standard
deviation describes how far, on average,
a score drawn at random from a given distribution of scores will deviate from the mean of
that distribution.
Does this definition help? How do you
interpret it?
Exercise
3: Interpret and use standard
scores.
In Evans’ discussion of the normal curve (or, more appropriately, normal distribution) he did
not talk about standard scores (or z
scores), even though this is where they would normally be introduced. So,
here, I will remedy that omission.
Standard
scores (z scores) play an important
role in measurement and statistics. Given a person’s z score, we can easily determine that individual’s percentile
rank. The z score also helps us
determine how likely or unlikely (rare) an individual’s score is in a
particular population. First, however, let’s see how we compute a z score.
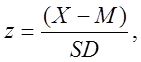
This is done
using the following simple formula:
where X is
the score to be converted to a z score,
M is the mean
of the distribution (of scores), and
SD is
the standard deviation of the distribution of scores.
For instance, suppose X =
37, M
= 32, and SD
= 5. Then,
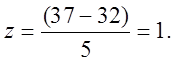
As another
example, in the same distribution, X =
27. In this case,
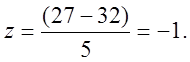
What do these
z scores tell us?
Look at
Evans’ Figure 6, where he shows the percent of cases lying within various
standard deviations of the mean:
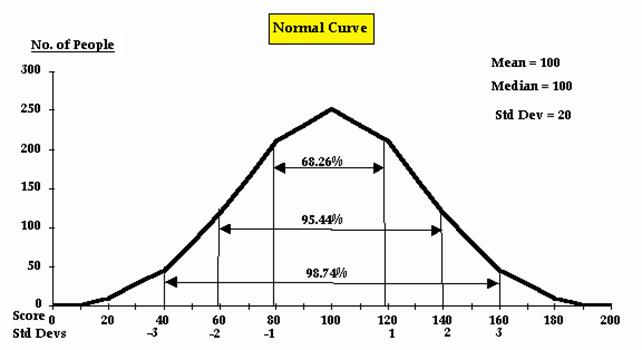
The bottom row of the figure, the one labeled Std
Devs, are also called z
scores. So we see immediately, that a z
score tells us how far, in standard deviation units, the corresponding scores (X)
is from the mean. In our case, the first z
score (1) is one standard deviation above the mean. Look at the figure. What
percentage of the cases is below a z
score of 1? Realizing that 50% of the cases are below a z
score of zero (the median of the distribution) we can determine that half the
cases in the interval described by -1 and +1 z
(or Std Dev) equals roughly 34% (68%/2) . So, the percent of cases below a z
score of +1 is 50% + 34% = 84%. Since a percentile rank is defined as the
percent of cases below a given raw score, X,
we conclude that a score of 37, in our distribution, is equivalent to the 84th
%tile. Similarly, a score of 27, which in our distribution is equivalent to a z
score of -1 is at the 16th %tile (I’ll leave it to you to figure
this out.)
For
this prompt, use the distribution having M =
32 and SD
= 5 to compute the %tiles for the following scores (rough approximations are
OK): 20, 25, 30, 35, 40, and 45. Which of these scores would you consider to be
rare in the distribution?
Also,
using the same distribution of scores, figure out the following:
What percent of scores fall
between 25 and 35; between 35 and 40; and between 40 and 45?
Exercise
4: Use a t test to test the difference mean achievement tests scores for two independent
groups.
In
lesson 3, Evans showed you how to compute two t
test for testing the hypothesis that the means of two groups are equal. The
first t test was for testing the
difference in means for two independent samples
(i.e., samples where what effects one sample has not effect on the other
sample.) The other t test is for two dependent
samples (i.e., samples where the score for one member of a pair is correlated
with the score for the other member of the pair.) Some examples of dependent
samples include pretest-posttest scores, husband’s and wife’s scores on a
political survey, and scores in samples where pairs of cases have been matched.
Below
is a table of test scores for two samples of students: males and females.
|
Males |
Females |
|
35 |
24 |
|
27 |
33 |
|
31 |
37 |
|
20 |
29 |
|
29 |
24 |
|
32 |
30 |
|
30 |
33 |
|
22 |
37 |
|
24 |
22 |
|
38 |
29 |
|
|
31 |
|
|
26 |
Compute
a t test to determine which group has the highest average test score.
Exercise
5:
Suppose you test the Null Hypothesis that the means of two groups receiving
different treatments are equal. You compute a two-tailed t test, with α
= .05, obtain a statistically significant result, and REJECT the Null
Hypothesis. What is the probability that you have committed a TYPE I error.
Explain your reasoning.