|
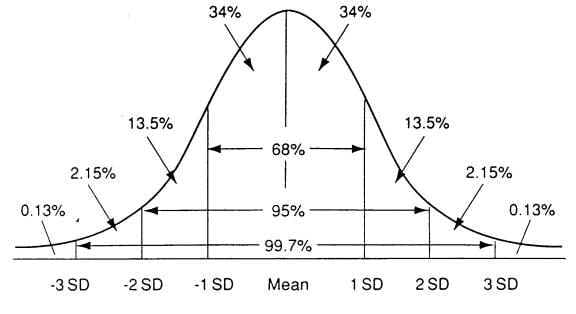
Graphic of Areas Under a Normal Curve |
| This graphic can be used to estimate values involving percentiles and standard scores. It can also be used to estimate confidence intervals using the standard error of measurement (SEM). | ||
| Standard Scores | Recall the formula
for computing a standard score (z),
where X is the raw score, the X with the bar over it is the mean of the group, and SD is the standard deviation. |
|
| Estimating the percentile given a standard score | First, compute the standard score using the equation above. | Example: Ben's score on a test having a mean of 52 and a standard deviation of 6 is 61. Using the equation, his standard score is 1.5. |
| Next, locate (positive) 1.5 on the graphic. | The point is half-way between 1SD and 2SD on the graphic. | |
| Ben's score of 61 is at the 91st percentile. | There are 50% (below the mean) + 35% (between the mean and 1SD + 7% (a little over half the percent between 1SD and 2SD). | |
| Estimating the standard score given a percentile | First, locate the percentile on the graphic. | Example: Matilda's score is at the 18th percentile. This point is slightly to the right of -1SD. |
| Then estimate the standard score. | (.13% + 2.15% + 13.5%) = 15.78%, or 16 percent when rounded. The area between -1SD and the mean contains 34%. Two percent takes us only slightly into the interval between -1SD and the mean. | |
| For all practical purposes, Maltida's standard score is -1 or, perhaps, -.95. | ||
| Estimating confidence intervals using the SEM | First, recall that the standard error of measurement (SEM) is a standard deviation. | Example: The SEM for the Omnibus Test of Assessment Competencies (OTAC) is 15. Mortimer's score on the test is 40. |
| To estimate the 68% confidence interval, take the individual's score and add and subtract 1SD in the graphic. | Placing Mort's score of 40 at the mean in the graphic, we can be about 65% confident that Mort's TRUE score on the OTAC lies somewhere in the interval, 25 to 55 (i.e., between -1SD and 1SD). | |
| The 95th and 99th confidence intervals are computed in similar fashion by taking the intervals: -2SD to 2SD; and -3SD to 3SD respectfully. | Similarly, we can be 95% confident that Mort's TRUE score is between 15 and 70; 99% confident that his TRUE score is between 0 and 85. | |