Sign Test
{Adapted from the Institute of
Phonetic Sciences (IFA):
http://www.fon.hum.uva.nl/}
The sign-test is crude and insensitive (to treatment effects) test. It is also the most convincing and easiest to apply. The level of significance can almost be estimated without the help of a calculator or table. If the sign-test indicates a significant difference, and another test does not, you should seriously rethink whether the other test is valid.
The sign-test can be used as an alternative to the paired samples t test, when the data do not meet the assumptions of the t test.
The sign test is one of the simplest tests of significance in the nonparametric category. It is applicable whenever we have paired observation, e.g., measures on A and B for each individual. The paired observations could be pre-test and post-test scores on the same individuals. Or they could be scores on the same test administered under two types of treatment interventions, say two different reading programs. Alternatively the paired observations might be scores for pairs of individuals where the pairs have been formed by matching on some other variable. In this situation one member of each pair is subjected to one treatment condition whereas the other member of the pair is subjected to a different treatment condition, possibly a control condition.
As an example, suppose we are interested in whether situational anxiety affects test performance. We might give a test (actually parallel forms of a test) to a group of individuals under two types of anxiety-inducing instructions: one (Treatment A) designed to induce low situational anxiety, the other (Treatment B) designed to induce high situational anxiety. Of course we would want to counter-balance the order in which the anxiety-inducing situation were applied–half would receive the low-anxiety instructions first and the other half, the high-anxiety instructions first. In each case an achievement test would be administered immediately following the anxiety-inducing instructions.
The (null) hypothesis to be tested is that the test scores under the two anxiety situations are due to sampling error, i.e., that there is no reliable difference between the median test scores under the two conditions. The data array, following the experiment, would look something like that shown in Table X. In the column, "Sign of (A-B)," are recorded the sign of the difference obtained by subtracting each pairs score under condition B from his or her score under condition A. When the difference is zero, as it is for the 3ed individual, the sign is discarded.
|
||||||||||||||||||||||||||||||||||||||||||||||
If the (null) hypothesis is true, half the differences should be positive and half should be negative. In other words, the median difference should be zero. In symbols, the null hypothesis can be given as:
H0: p(+) = p(–) or p(+) - p(–) = 0
Where ,p, stands for "probability." The above equation reads, Hull Hypothesis: the probability of a plus equals the probability of (a minus OR a plus) minus the probability of a minus is zero.
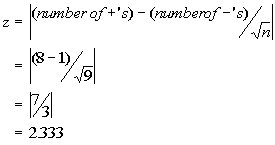
The exact probability of our outcome (six positives in eight trials) is 36/512, or .0703 for a one-tailed test, or .1406 for a two-tailed test. This value was obtained using the binomial expansion, but may be approximated, especially for large samples (n > 30) by computing

and looking up the probability of Z in a table of areas under the normal curve.
You can also compute the sign test by clicking here: Sign-Test.